All New: Evaluations for RAG & Chain applications
Introducing Data Error Potential (DEP) - New Powerful Metric for Quantifying Data Difficulty for a Model


When building a machine learning model, it becomes critical to understand cases when our model is going wrong or most likely to go wrong in production.
From a data lens, a natural representation of this is through quantifying how hard a given data sample is for a model to learn - where the hardest samples are those that are most contributing to model failure modes or represent data errors that are similarly clouding the model’s ability to learn.
When ignored, this often leads to terrible results once the model is launched.


Broadly, reasons for why some data ends up being ‘hard for the model’ to understand can fall into two categories
1. Data Errors / Issues
- Noisy Samples (garbage)
- Mislabeled Data
- Multi-Meaning Samples
- And more
2. Data Limitations
- Outlier Samples
- Class Overlap and ambiguity around decision boundaries
- Low class or import data subset representation
- And more
Finding The Long Tail Of Data The Model Struggles With Is Crucial
‘Garbage in, garbage out’ – in the data world, this is an oft used phrase; when building machine learning models, it becomes even more critical to identify the ‘garbage data’. 3 reasons for this:
1. To better understand model limitations
- Dig deeper into model errors – what data is the model failing on? Why is it behaving that way?
- Identify critical data cohorts that are underperforming and identify why
2. Uncover Data Quality Errors
- Find problems with the data itself – blurry images, garbled data, etc
- Biases in the data – imbalances in model performance for critical data cohorts based on gender, race, location, etc
3. Help discover high value data to add
- Finding critical data cohorts where we need the model to perform better – eg finding out that your contact center AI solution doesn’t work well for native Spanish speakers requires adding more Spanish transcripts in to the training data
Introducing Data Error Potential (DEP) - New Powerful Metric for Quantifying Data Difficulty for a Model
Traditionally, data scientists use the models’ Confidence score to rank the difficulty of data.
Confidence generally is not a good metric to represent the most useful data during training because of the Deep Learning model’s tendency to be over-confident even when they’re very wrong.
How do we calculate Data Error Potential (DEP)
- Starts with calculating Area Under the Margin (AUM)
- Margin = prob_GT - prob_(highest not GT)
- AUM = Average_Epochs(Margin)
- DEP = (1 - AUM) / 2
To provide more intuition about this calculation:
- What does margin capture? It captures the model's certainty in its prediction w/r to the assigned label for the sample. In a sense combines Self-Confidence and Confidence.
- Why average? The average helps further qualify difficulty throughout the training process, not just at the end - e.g. helps alleviate issues in overfitting.
Using DEP to Supercharge Model Error Analysis – A task agnostic data error score
DEP provides a tool to very quickly sort and bubble up data that is most difficult and worthwhile to explore when digging into your model’s errors! Since DEP is task agnostic, it provides a strong metric to guide exploration of model failure modes.
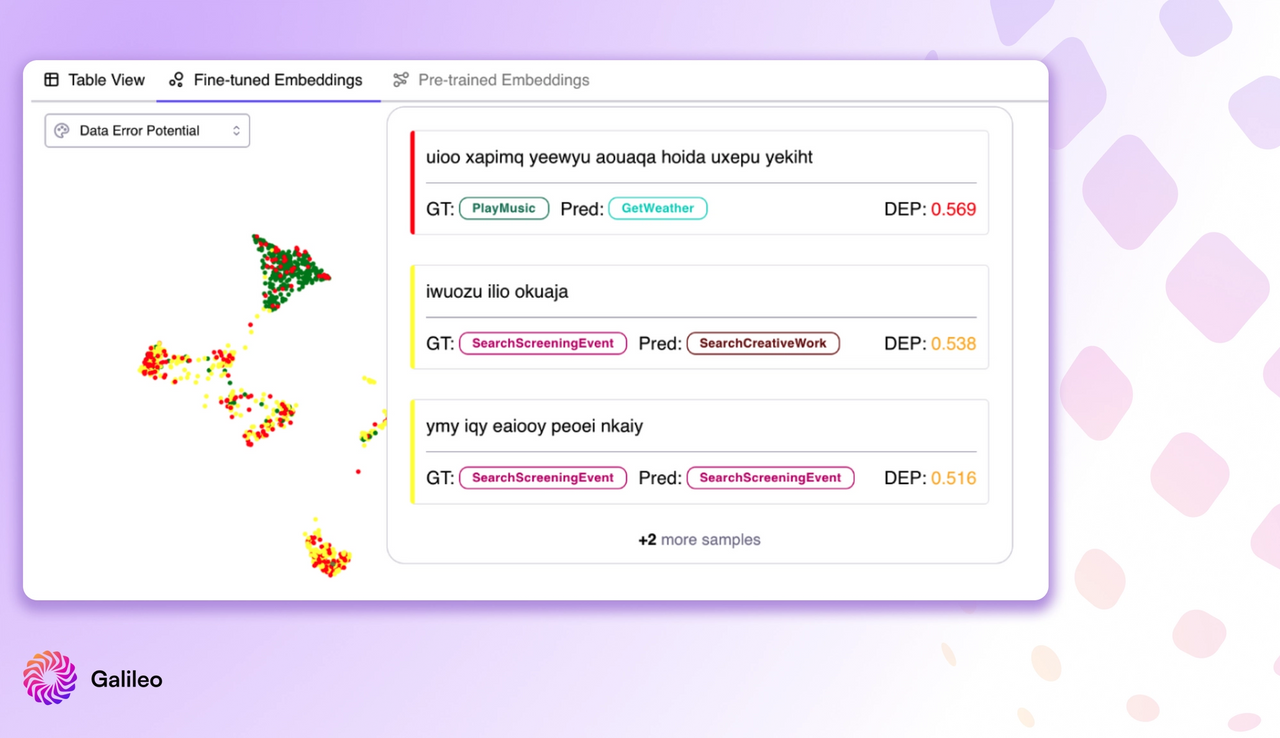
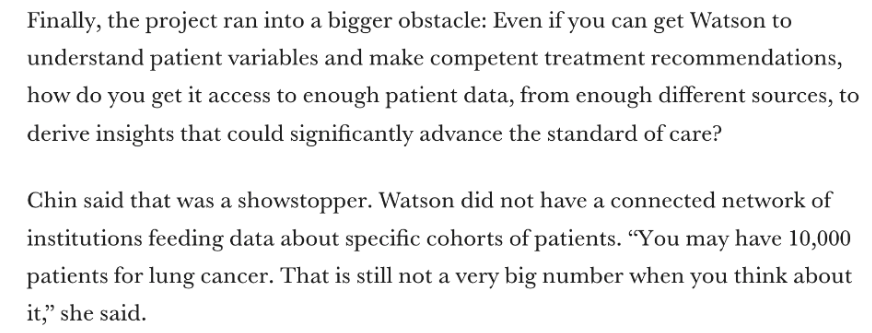
Example 1: Inspecting the model’s embeddings by coloring using the DEP scores (red = high DEP, green = low DEP), we can quickly get an ‘X-ray’ view of the data. Here, you can see an island of high DEP data points. On hover, it turns out the data is garbage text that you can then quickly remove ahead of re-training [Explore a run here]

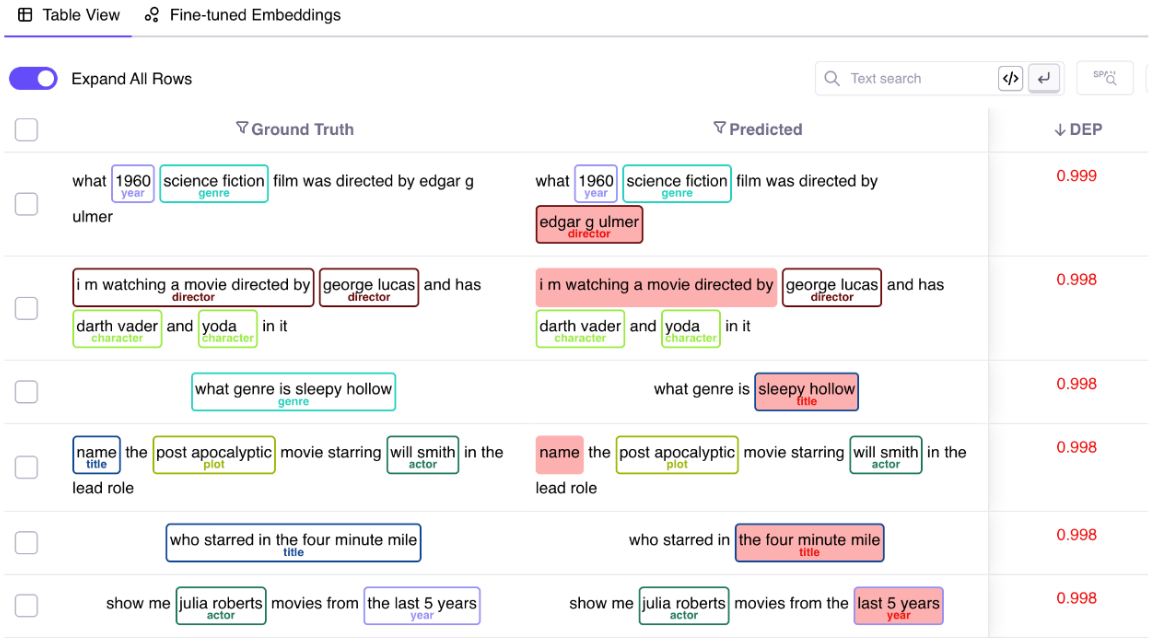
Example 2: When building a NER model, it is important to identify the spans the model struggled with. By calculating the DEP score at a span level, this becomes easy to identify. [Explore a run here]

SUMMARY
Given that around 80% of a data scientist’s time is spent looking for the data that the model struggled with, the Data Error Potential (DEP) score is a mechanism to rapidly short circuit this evaluation process. By identifying and fixing this long tail of data, data science teams can improve their model prediction quality by a meaningful amount, 10x faster than ever before.
Explore the DEP score with Galileo by signing up, or feel free to book a demo with someone on the Galileo data science team.
References & Acknowledgments
The callibration and the building blocks of the DEP score are based on (but not restricted to) following research papers and artifacts:
- Identifying Mislabeled Data using the Area Under the Margin Ranking, Geoff Pleiss, Tianyi Zhang, Ethan R. Elenberg, Kilian Q. Weinberger
- Dataset Cartography: Mapping and Diagnosing Datasets with Training Dynamics, Swabha Swayamdipta, Roy Schwartz, Nicholas Lourie, Yizhong Wang, Hannaneh Hajishirzi, Noah A. Smith, Yejin Choi
- Fix your models by fixing your Datasets, Atindriyo Sanyal, Vikram Chatterji, Nidhi Vyas, Ben Epstein, Nikita Demir, Anthony Corletti
And last but not least, a special thanks to all the original contributors and creators of the DEP score from the Galileo ML Research Team - Nidhi Vyas, Nikita Demir, Jonathan Gomes Selman, Robert Friel, Bogdan Gheorghe and Derek Austin.
Working with Natural Language Processing?
Read about Galileo’s NLP Studio
