All New: Evaluations for RAG & Chain applications
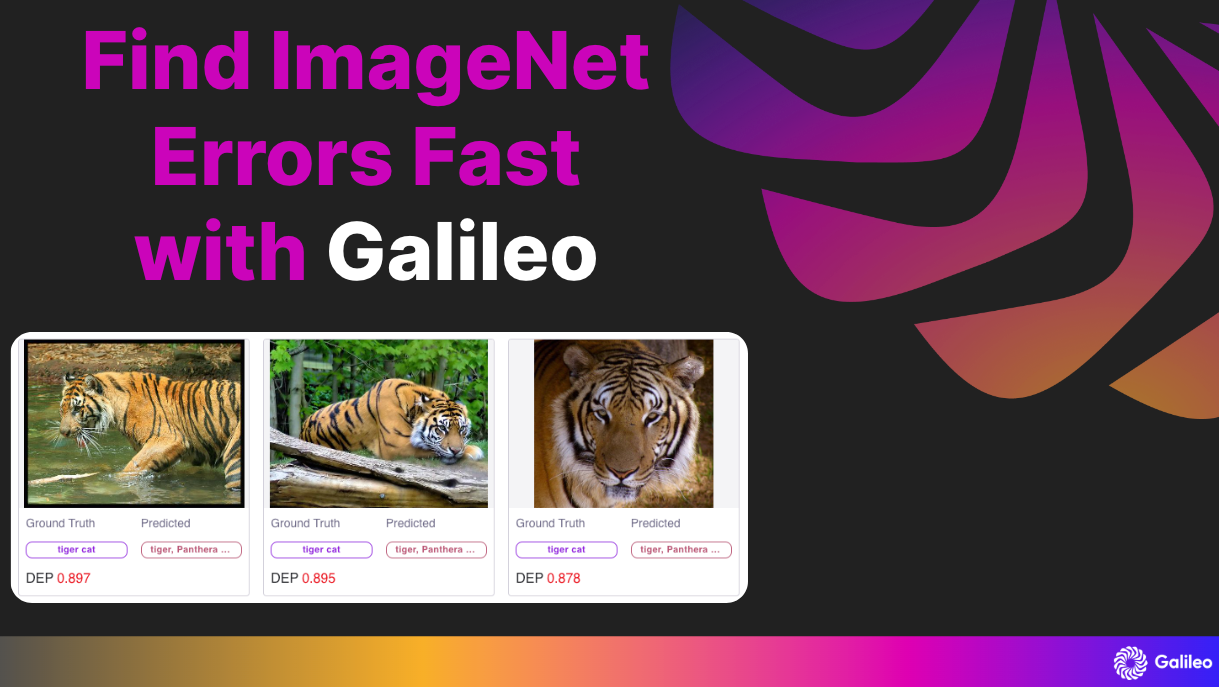
ImageNet Data Errors Discovered Instantly using Galileo


Tl;dr: We inspect the popular ImageNet dataset and quickly find data quality errors while training a model. To learn some of the best tips and tricks to uncover critical data errors fast, sign up for our upcoming webinar with leading computer vision experts.
ImageNet is by far the most popular computer vision dataset used today with over 50,000 citations. It contains 1000 different classes, with 1.2 million samples as a whole. It seems that all new computer vision architectures (ResNet, ViT, MaxViT) first have to obtain state of the art accuracy results on ImageNet before gaining any sort of popularity in the community as a whole – therefore most practitioners take ImageNet as the gold standard for image classification.
However the dataset was released in 2012 and has rarely been updated since. Using Galileo, we sought to find out just how good ImageNet is and how we can debug one of the most cited datasets in AI today.
Training Run Setup
We first restrict the dataset to ImageNet-100 which has about 130k training images representing 100 different classes before subsampling further to get about 23k training images in total. We then use a pre-trained ImageNet ResNet-50 model from TorchHub and train for 5 epochs fine tuning all layers and logging our embeddings and model outputs with Galileo’s dataquality client (tutorial link).
Inspecting and Fixing Data Errors in Galileo
After training we are able to view our results in the Galileo console and sort by Data Error Potential (DEP) in order to surface the most likely errors in our training data. What we find, which is no surprise to industry practitioners, is tons of errors.


Tigers or Cats?
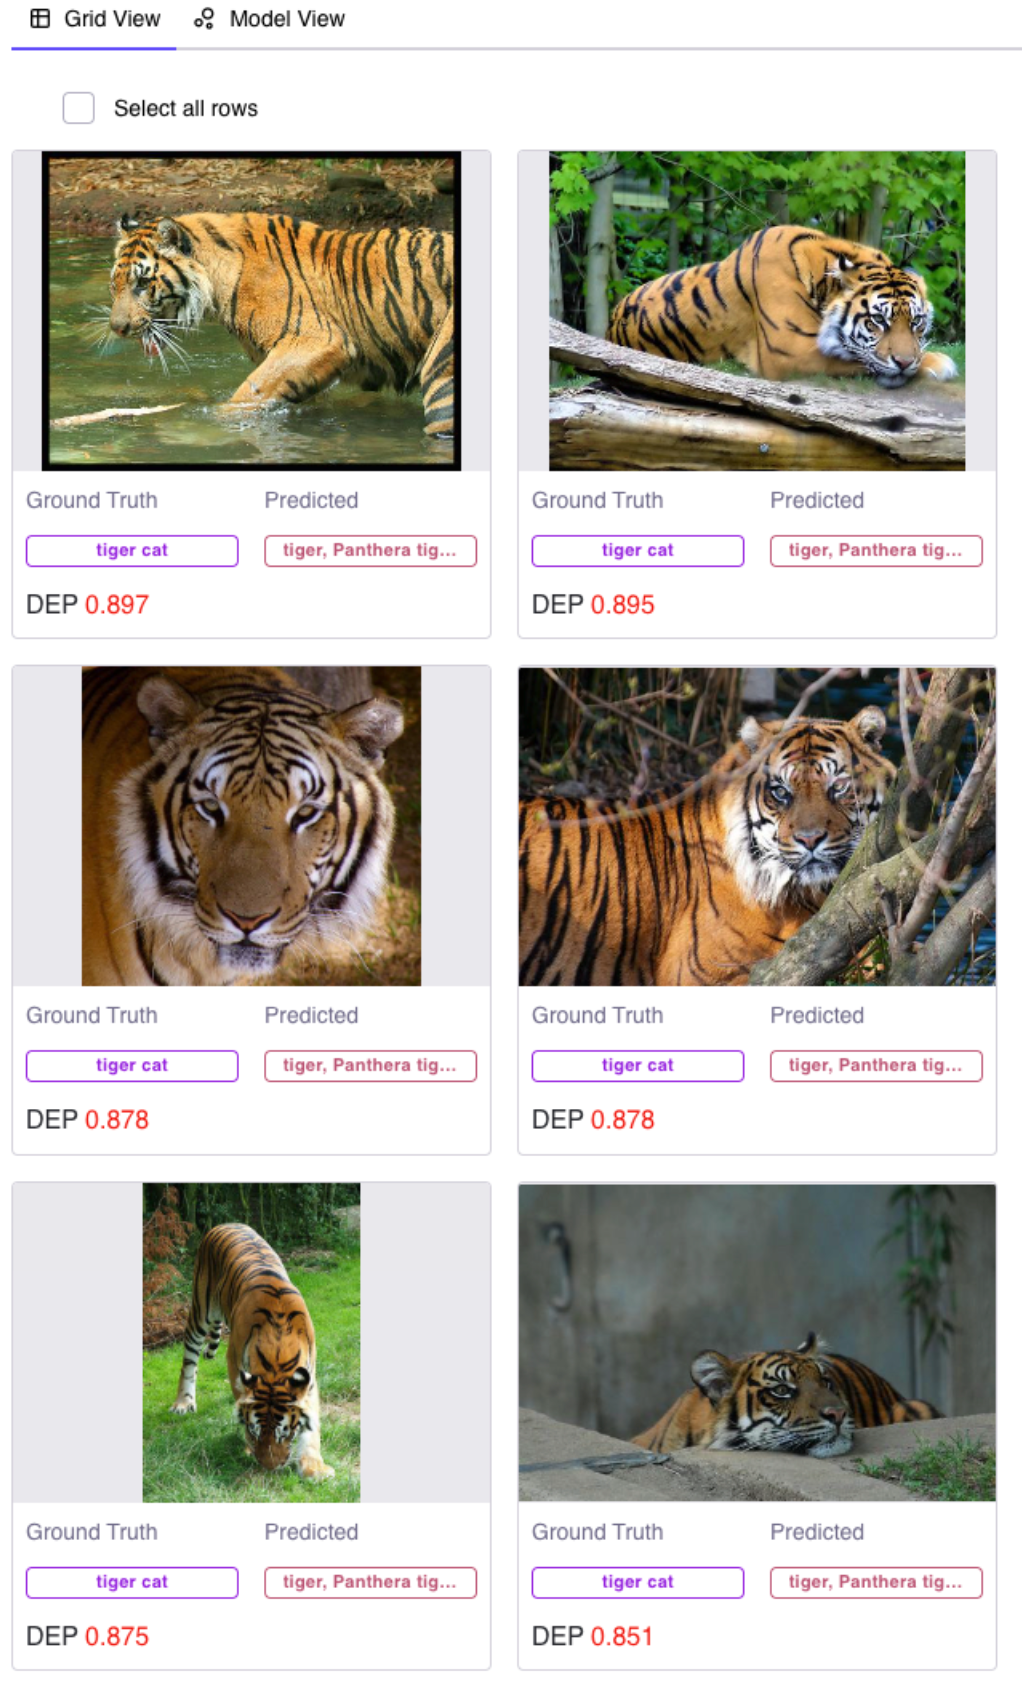
To give you a better idea we manually examine the first 50 images sorted by DEP. We can quickly say with confidence that 44 of them are mislabeled (for 5 images, we cannot say with certainty – if anybody can tell with certainty the difference between a boar and a hog let us know) and 1 that is correctly labeled.
For example, we can qualitatively see that an obvious error is a mislabeling of ‘tigers’ as ‘tiger cats’!

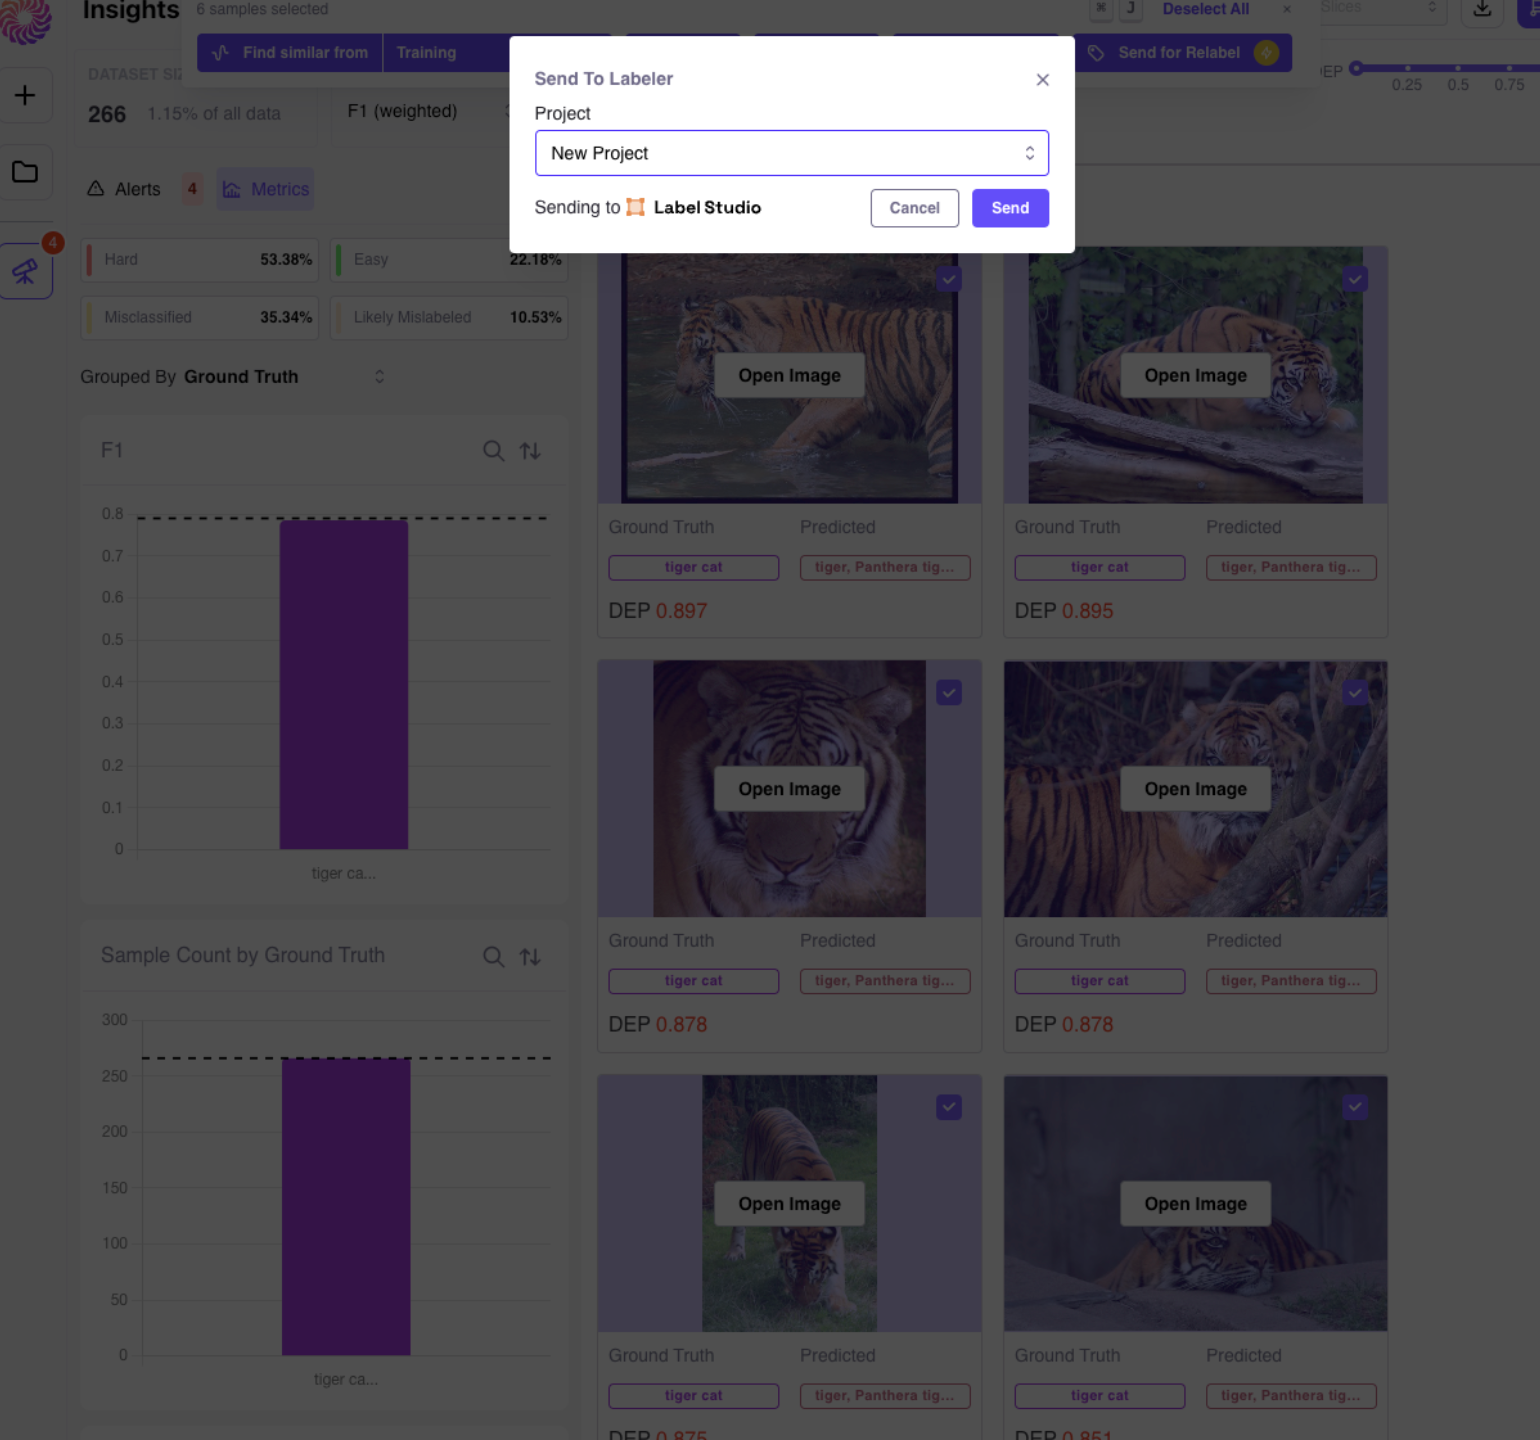
Additionally, we can select the images we know are in error and send them to our third party labeler for immediate correction – you could also simply bulk relabel within Galileo itself.

A high DEP cluster of Terrier Dogs
We can then transition to the embeddings view and identify a group of embeddings with consistently high DEP. After using our lasso tools to examine just those points of interest, we discover that it primarily consists of terrier dogs, which can often be challenging to distinguish!
Further inspection of high DEP Misclassified Label Pairs
We can go beyond the embeddings view for our selected samples and examine the most misclassified pairs in our group as well in order to gain insights on how we can improve model performance in the future. We navigate to the metrics tab and examine top misclassified pairs which can help users gain a better understanding of exactly where your model is doing wrong.

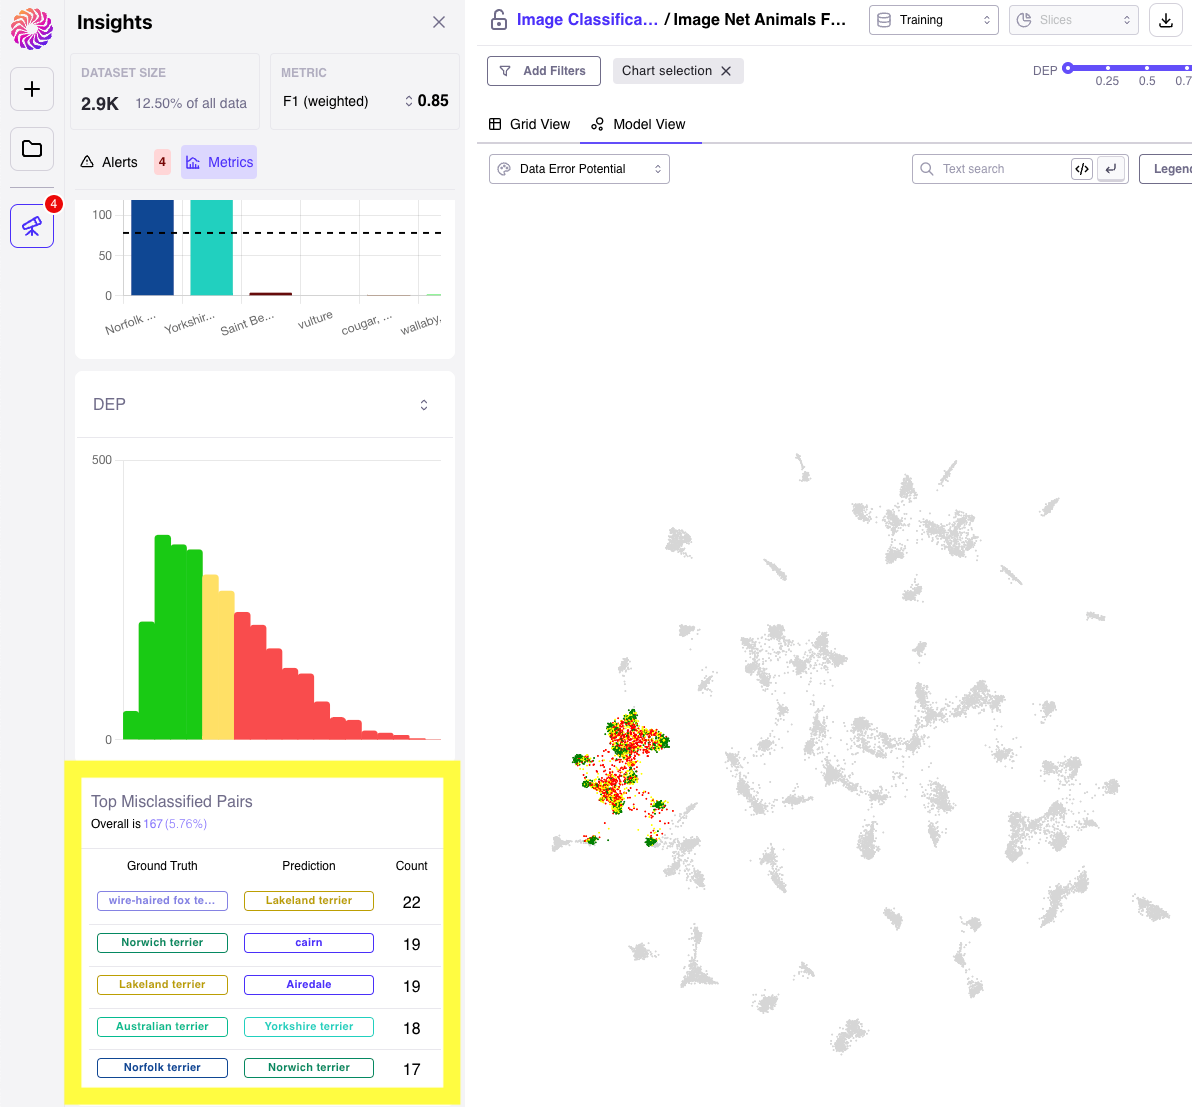
We find the white-haired fox terrier and the lakeland terrier are the most misclassified group out of this bunch which makes sense when looking at these photos.

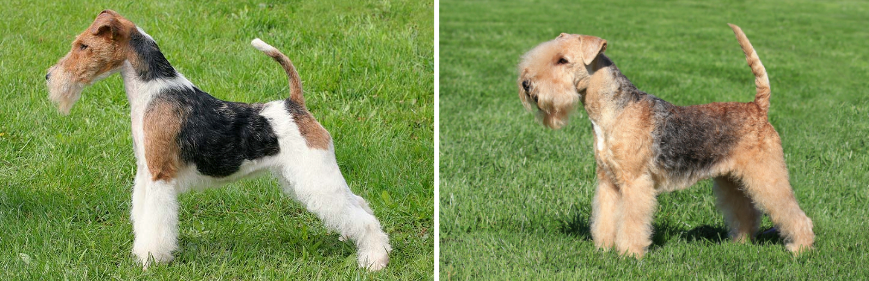
One could glean that the most obvious differences between the two is color, and therefore decide to going light on the color augmentations in the next training run likely improving model performance!
Underperforming Classes
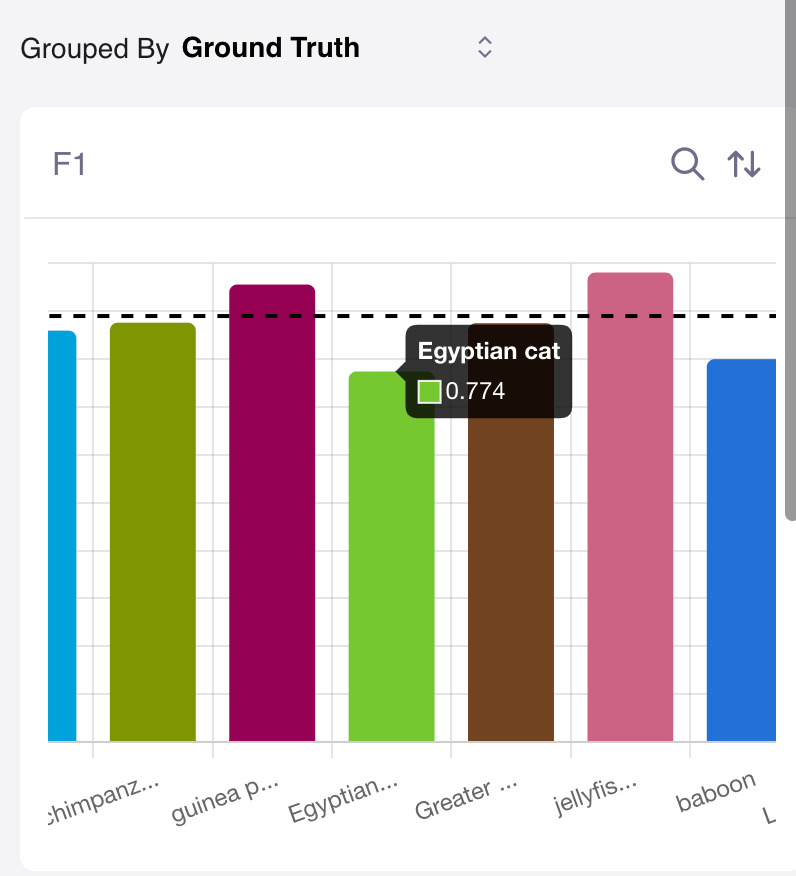
Although we have identified some challenging categories for our labelers, we also find instances where our model underperforms based on our chosen evaluation metrics (F1 score or accuracy). Specifically, our model struggles to accurately identify baboon’s in our validation set achieving only 71% accuracy compared to our dataset average of 89% accuracy. We find the likely cause of the problem to be class imbalance in our training set as we only provide 180 training images compared to the dataset average of 230 images. We could then either decide to improve our augmentation methods, or collect more data to ensure our learning algorithm is more robust when deployed.

Out of Coverage Samples (Data Drift)
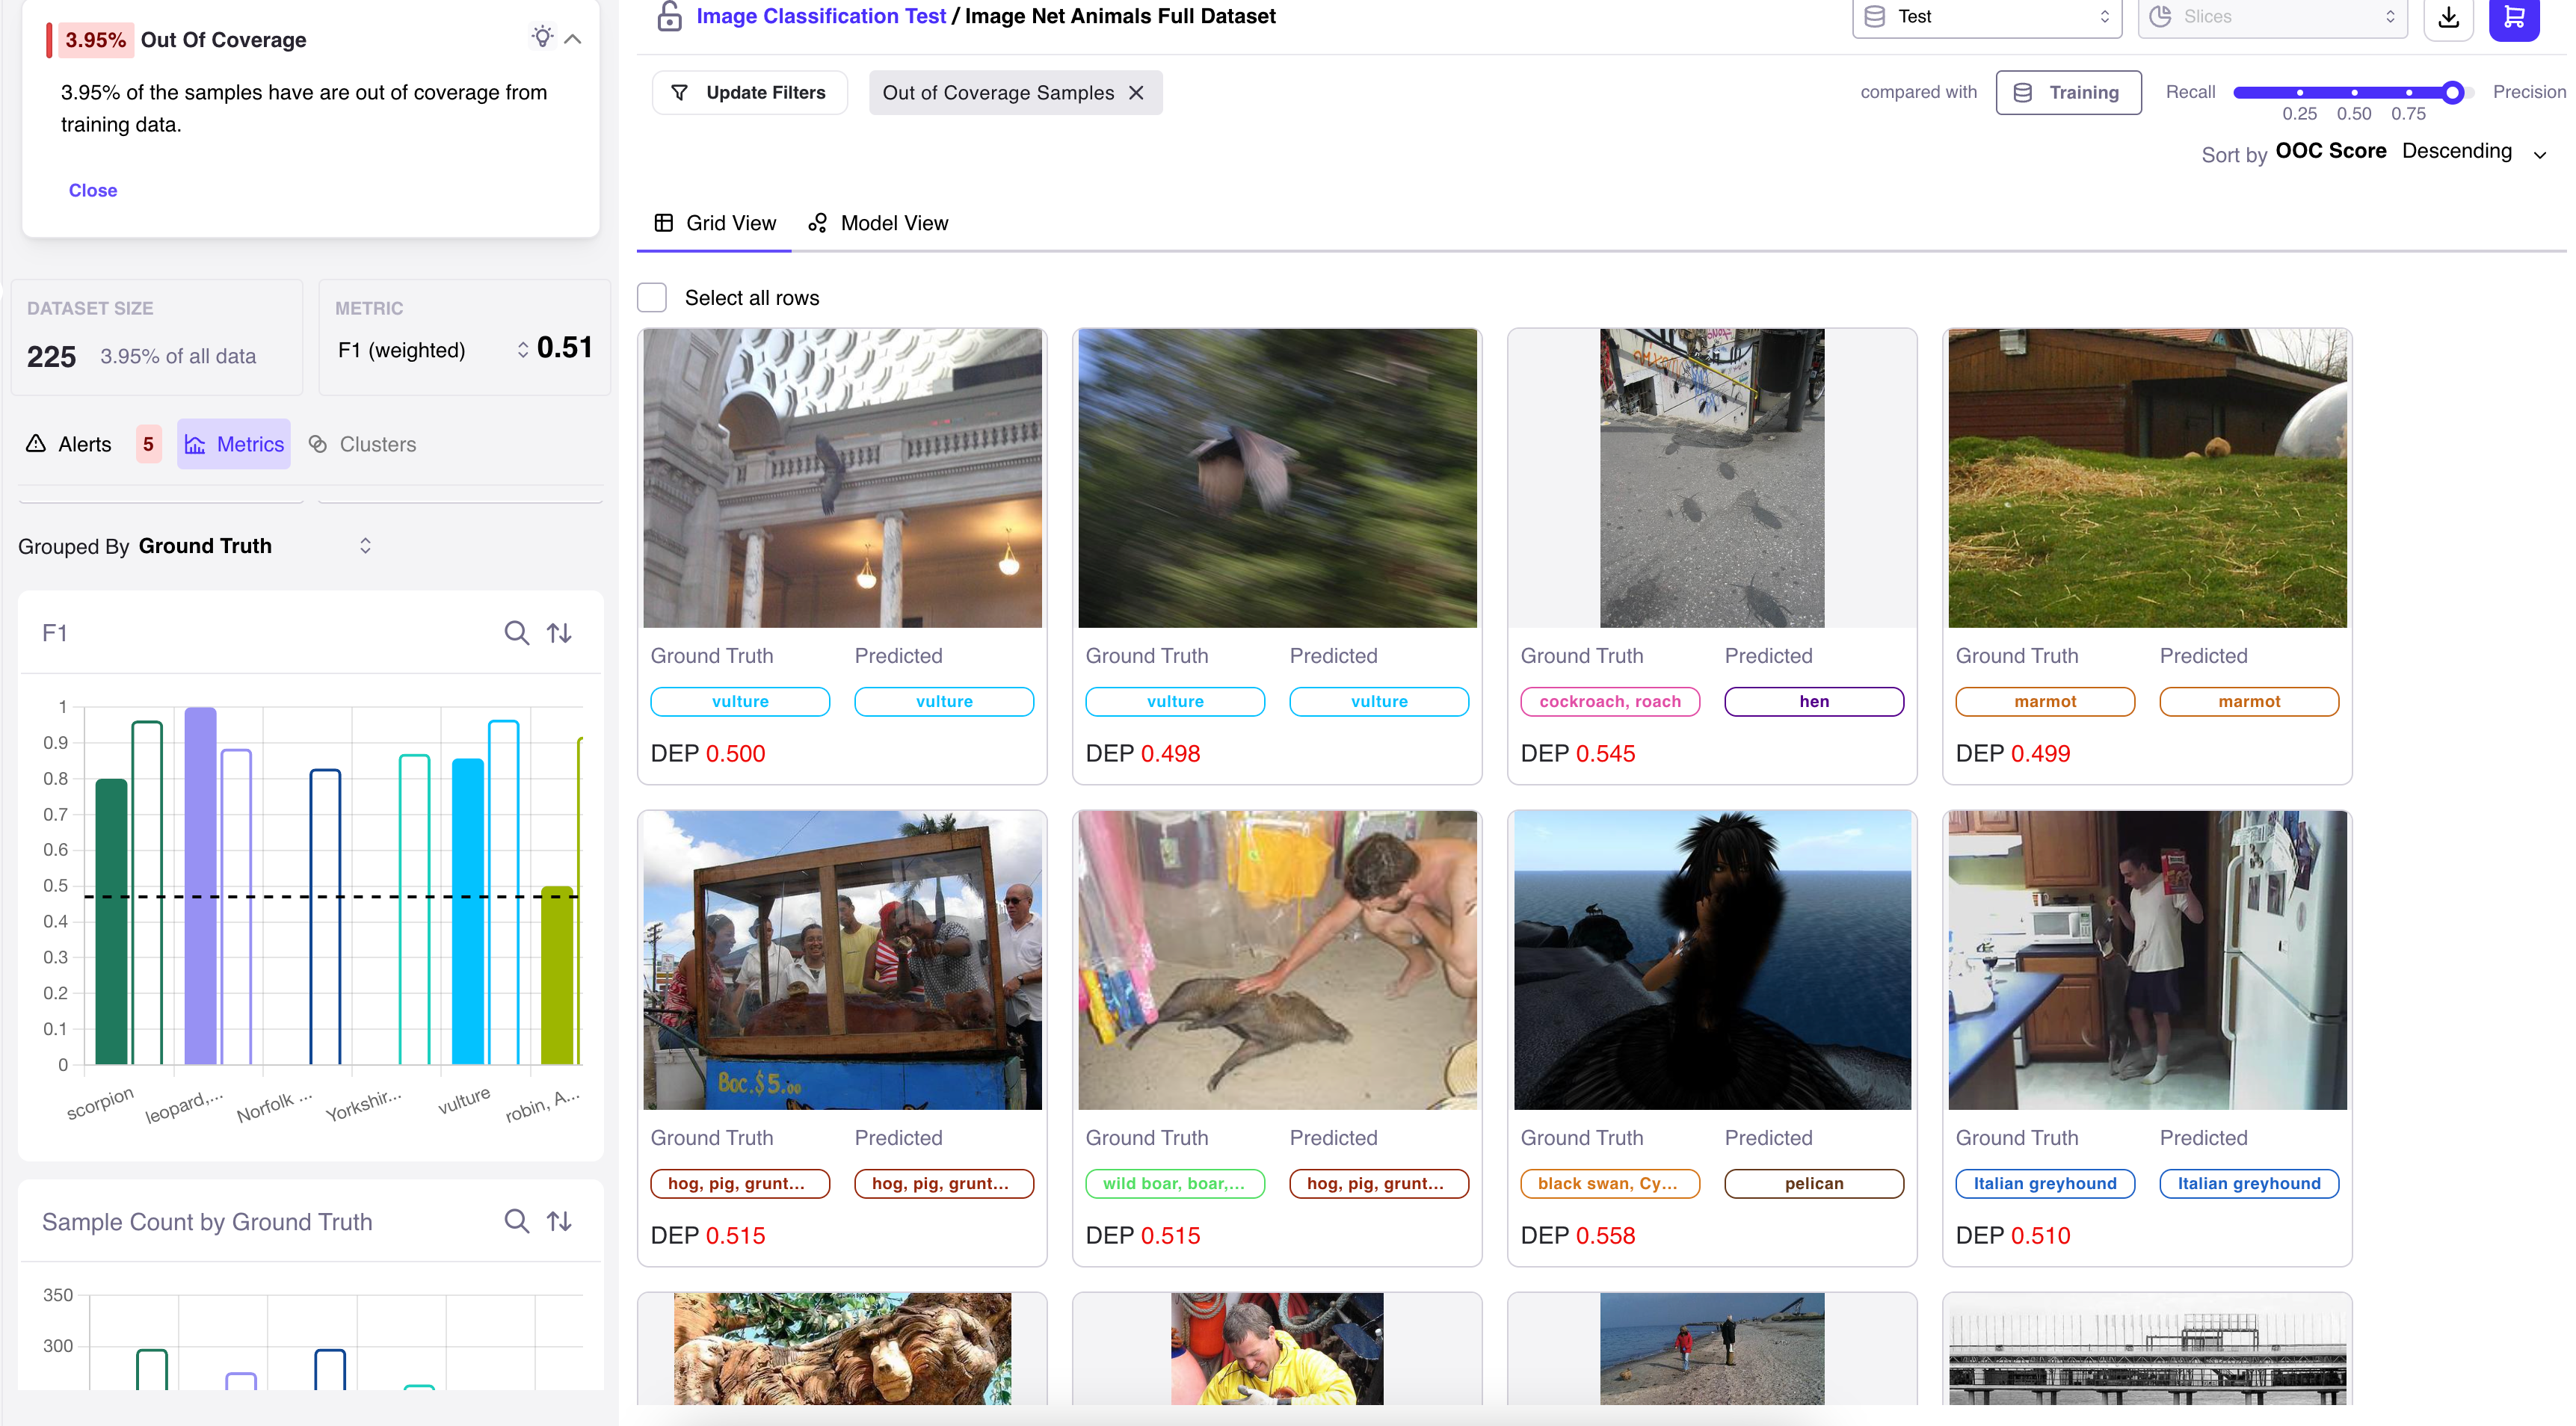
While we hope that your datasets are appropriately balanced and consistent between training and testing/production, we know that this is rarely the case. To address this, we provide you with the option to review test samples that may fall outside the coverage of your model. This feature allows you to identify and address potential gaps, ensuring that your model's performance remains robust across various data scenarios and that you can quickly identify when you may need to retrain on more representative data.
For example, the following images were flagged for being outside the coverage of our original training dataset:
- A vulture inside a building, which would be quite unusual.
- A blurry picture.
- A pig inside what looks to be a food truck.
All of these instances have been flagged as deviating from the scope of our original training dataset thus identifying gaps in your training dataset that may need to be patched before deploying to production.

SUMMARY
While ImageNet is one of if not the most cited dataset used in the world today, we can see that even on a small subset of the data it is far from perfect. Simple mistakes like mislabeling a tiger for a tiger cat can have drastic effects on training and performance estimation when deploying a model in production. To see Galileo in action and deploy runs for other common Computer Vision datasets see this notebook.
Sign up for our upcoming webinar about data-centric model building with leading computer vision experts from Pinterest and Elbit Systems.
Working with Natural Language Processing?
Read about Galileo’s NLP Studio
